Visual analysis soon reaches its limits
Ideally, problems can be better understood by creating a Wardley Map of the perceived situation. For some scenarios, however, this is not sufficient and several maps are created for the same context. This may occur for several reasons, including:
- A scenario is too large to be meaningfully represented on a single map.
- The structure of the map is hierarchical, a section or a component on a map is visualised as a separate map.
- Several questions are linked in terms of content and may refer to the same origin, for example.
- Several maps have been created for one question over a period of time, representing different levels of knowledge.
How can such situations be dealt with? In the simplest case, only the maps themselves are available, i.e. handwritten on a sheet of paper, on a digital or analogue whiteboard or created with specialised software. It is always possible to try to draw conclusions from a simple comparison of the maps. However, as the number of maps being compared increases and the more complex the individual maps are, the more difficult this task becomes.
Which tools offer structured queries on Wardley Maps?
As of 2022, the tool landscape for creating Wardley maps is rather limied: Online Wardleymaps and Mapkeep are probably the most widely used due to their ease of access. You can find other tools and resources at https://list.wardleymaps.com/#apps.
None of the tools has advanced query or evaluation options and what they all have in common is that they are not compatible with one another due to a lack of common standards. It would be desirable to have query languages and evaluation options such as those already known from databases. Graph databases seem particularly suitable for recording Wardley Maps and analyzing them with the integrated query languages. To date, no tool exists that links the visual creation of maps with graph databases - more on this later.
But maps are not graphs, are they?!

X : Why is it not a graph?
— Simon Wardley ❤️🇺🇦 (@swardley) July 4, 2019
Me : Maps are graphs but not all graphs are maps. To explain, one of these is a map, one of these is a graph. See if you can spot the difference … pic.twitter.com/gZBdf2NQqZ
Unlike a graph, the spatial arrangement on a map has meaning, as do distances and spacing. If a map is viewed as a graph, this essential information is lost in the visual representation. Concepts such as evolution, where the spatial arrangement along the evolutionary scale and the distance between components have meaning, can no longer be expressed visually in this way.
The physical representation of the map, e.g. in a graph database, can of course still contain this information in encoded form and is thus accessible for algorithmic evaluations. Essential statements about the map can be made by navigating within the graph and referring to properties of the nodes representing the map components (e.g. the degree of evolution).
It is therefore not necessary to work exclusively visually with maps. If a map is transferred to a graph database, it is possible to operate with structured queries on the graph of the map. This facilitates the evaluation of large amounts of data and enables the automated recognition of patterns.
Example: Wardley Maps in Neo4j
Simon Wardley publishes maps from open mapping sessions at https://github.com/swardley/Research2022. In what follows, I use maps that were created in the context of collaborative mapping sessions and published there are used:
- agriculture/agriculture-food-traceability and security (Github) (Preview with Onlinewardleymaps.com)
- agriculture/agriculture-food-waste (Github) (Preview with Onlinewardleymaps.com)
Both maps originate from the same context, but depict different issues, as the respective titles already reveal. How can we find out whether there are components that appear in both maps? First, the maps are transferred into a Neo4J graph database in order to apply structured queries to them using the Cypher Query Language.

The graph can be reduced to the components that appear in both maps with a simple query:
MATCH (m1:MAP)-[:CONTAINS]->(c1:COMPONENT)
MATCH (m2:MAP)-[:CONTAINS]->(c2:COMPONENT)
WHERE c1.name = c2.name AND m1 <> m2
RETURN DISTINCT c1, c2, m1, m2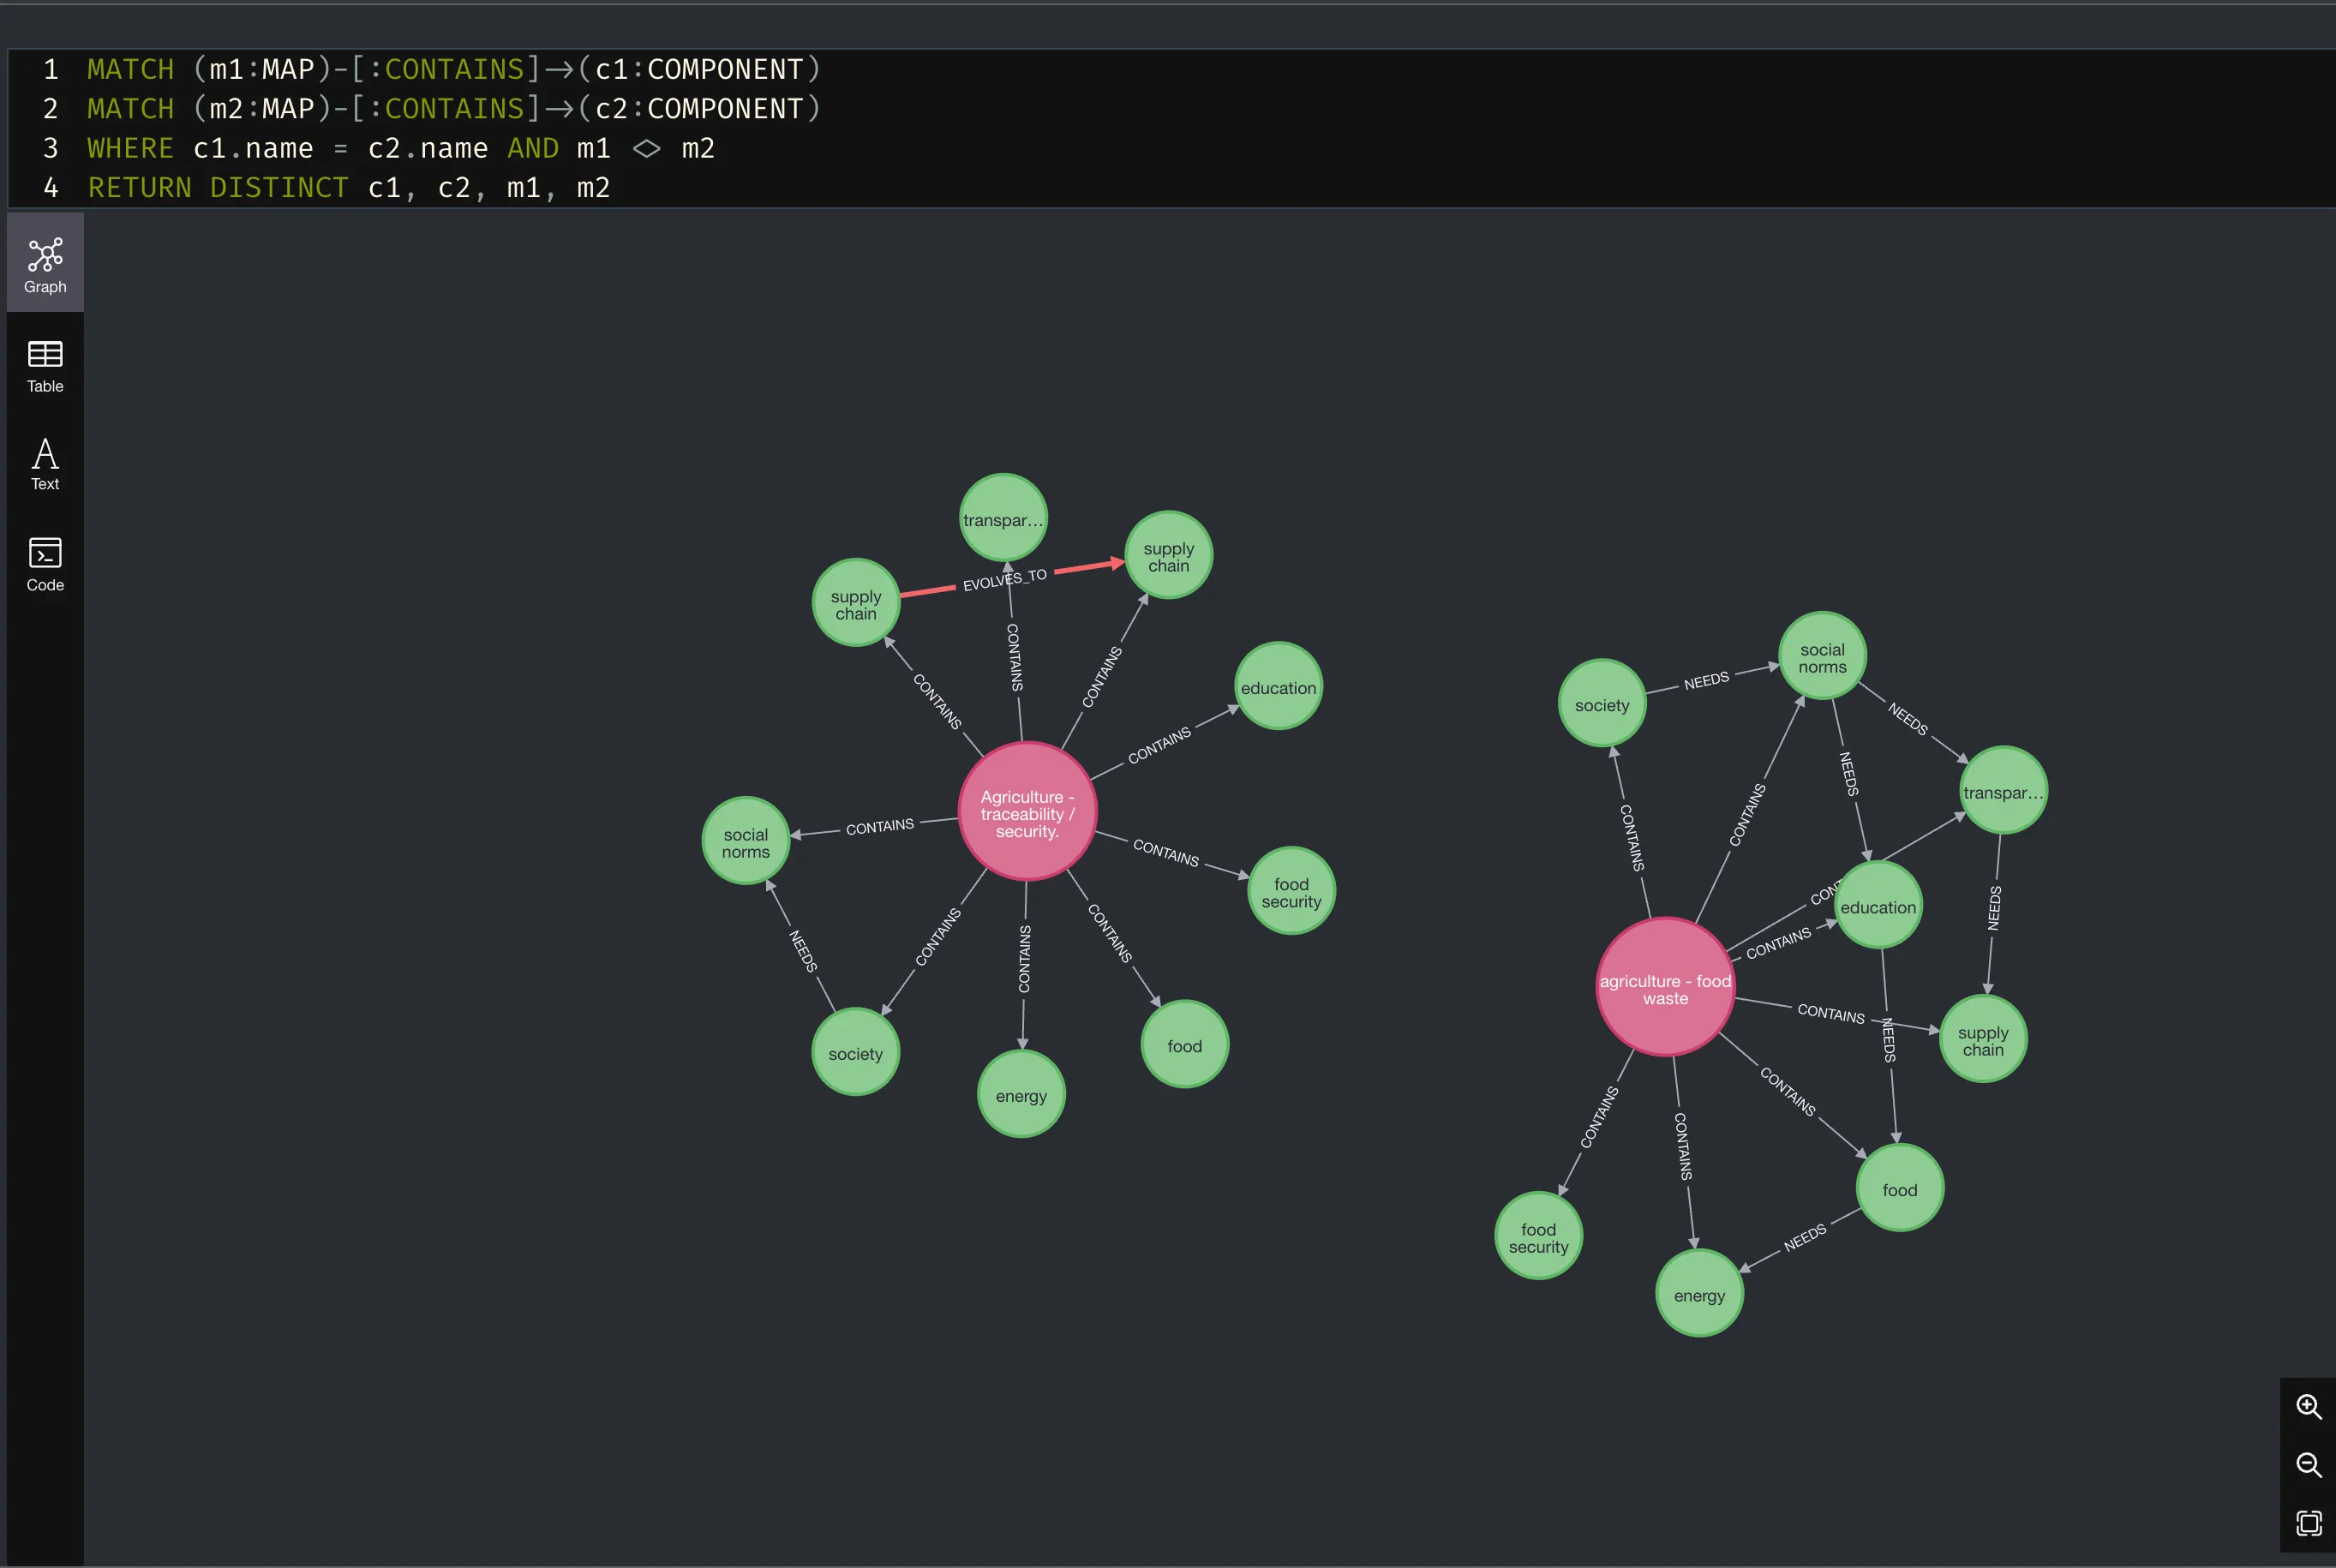
Neo4J comes with a very usable browser that is helpful in analysing and formulating even complex queries. In addition to a graphical representation, it is also possible to display a list of the results:

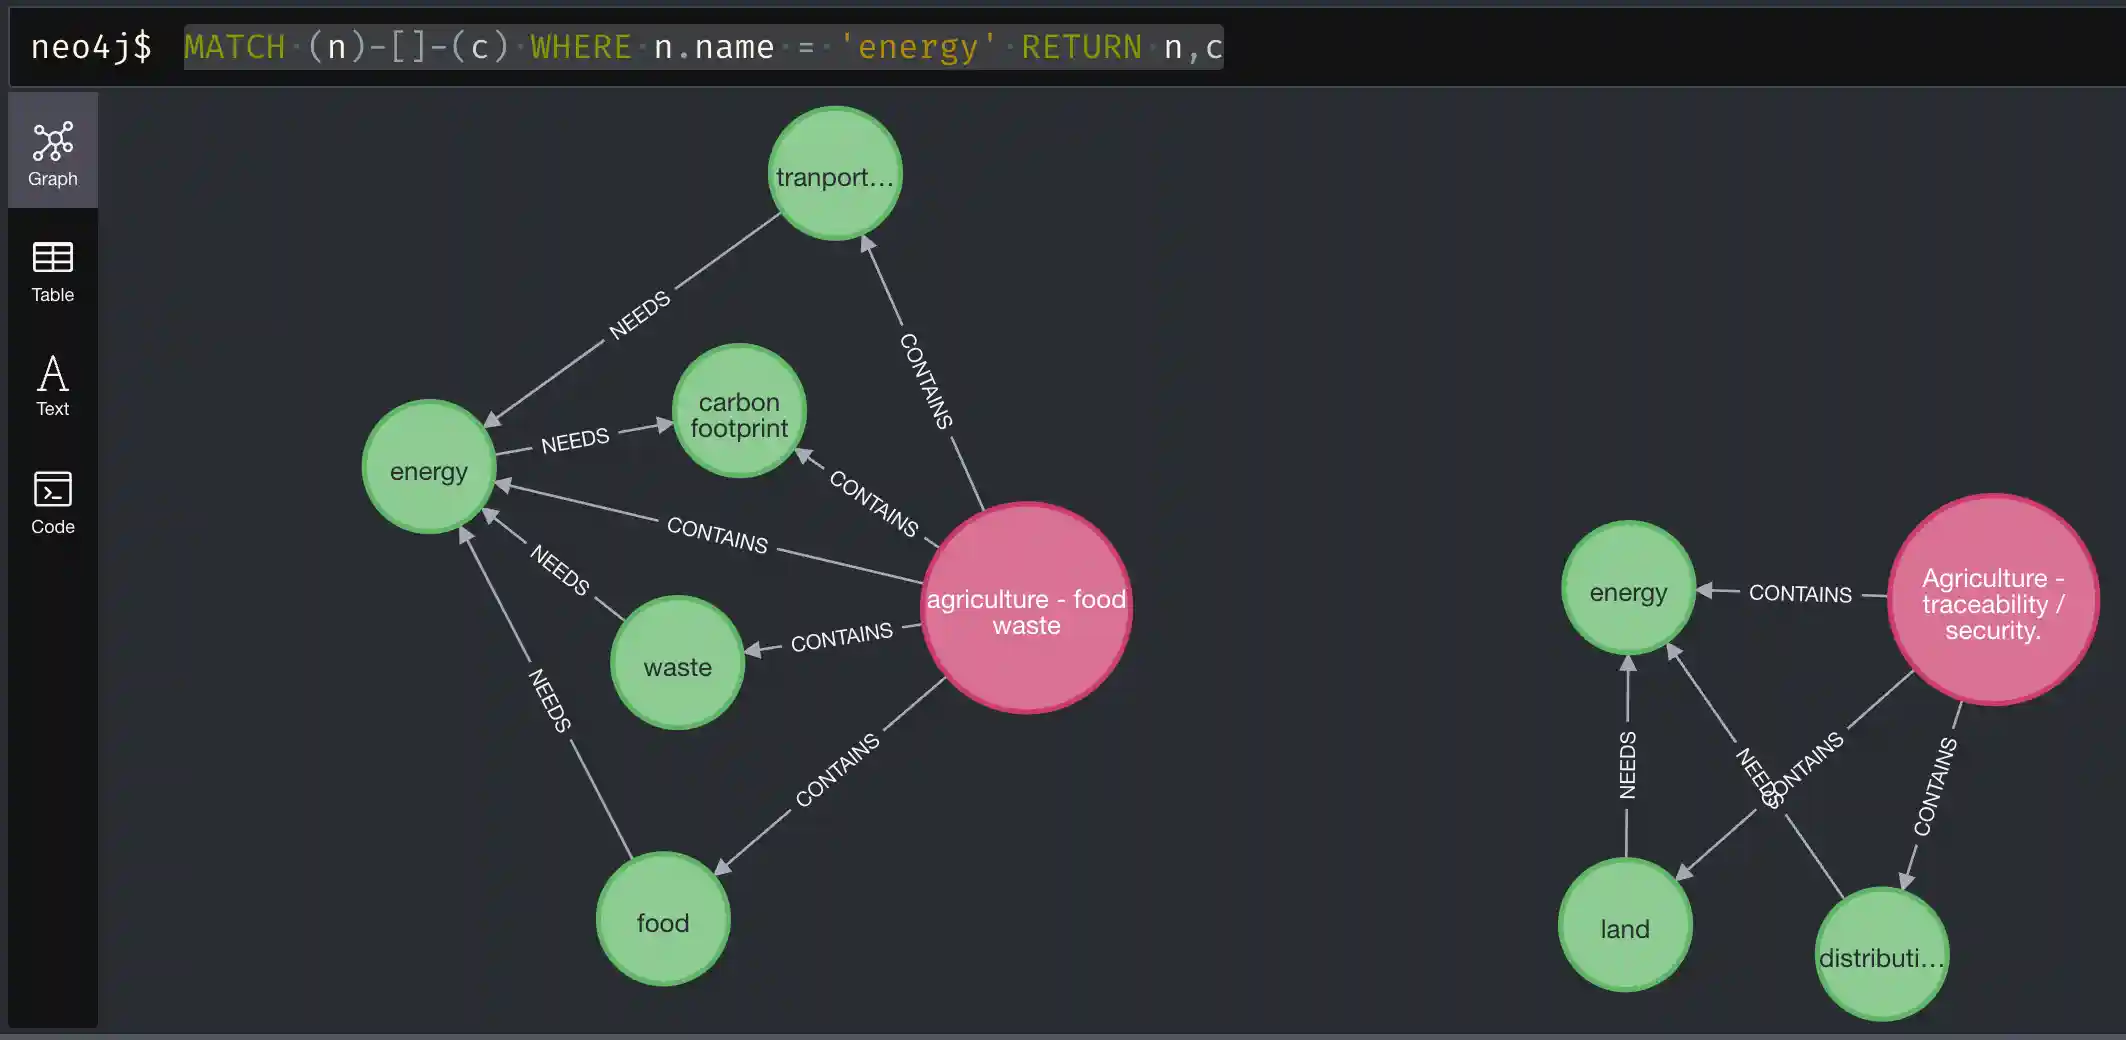
The repeated components can be further investigated, e.g. by displaying their directly connected components in both maps:
MATCH (n)-[]-(c) WHERE n.name = 'energy' RETURN n,c
More use cases
Applying structured queries to maps opens many interesting avenues for analysis, as well as broadening the range of tools that can be used. With Neo4J Bloom, for example, a data science suite is available, which operates on graph databases and can be used for further analysis of Wardley Maps. Other noteworthy possible applications are:
- Pattern matching: Identification of components with certain characteristic properties, e.g. high visibility with a low degree of evolution.
- Path analyses: If costs are defined for each link in the underlying value chain, it becomes possible to determine the lowest cost path algorithmically, thereby aiding business strategy development.
This list can certainly be extended, but one thing is certain: Algorithmic evaluation offers completely new perspectives.
How do you convert a map into a graph database?
In order to be able to analyse Wardley maps with structured queries, one must first transfer them into a graph database. This is a task which poses some difficulties, including:
- There are only a few tools to create maps in a structured way and export them in a text-based format.
- There is no uniform standard for the definition of Wardley maps, all approaches are proprietary.
- Manually transferring a map definition from a specific tool such as Online Wardleymaps, with the available tools of the respective graph databases is rather tedious.
- It is not possible to automatically update the database when changes are made to the original map.
Parsley: A free parser for Wardley Maps
To address the above problems, Parsley was developed as part of a proof-of-concept. Parsley is an open source Parser for Wardley maps, which allows for maps created with Online Wardleymaps to be transferred into a Neo4J graph database. The examples shown above were persisted in the database using Parsley for further analysis. Parsley is available under MIT licence on Github and can simply be operated locally as a Docker container.
The need for Standards
The Wardley Mapping community is growing steadily, as evidenced by now established events such as the Map Camp and the lively tool development. What is missing, however, and should also be driven by the community itself, is the development of interoperable standards. First and foremost is the standardisation of a human- and machine-readable format for defining Wardley Maps. A common, ubiquitous language would promote the evolution of existing and new tools. and new tools. A standardised description language could contribute significantly to dramatically increase the interchangeability and compatibility, and thus the directly perceptible benefit of the tools.
@swardley laid out his plan: “ultimately, I want Standards to be set by the community”, which meshes well with @juliusgb2k setting up a #WardleyMaps Standards Working Group. We’ll likely need to split this up, eg: knowledge, data, grammar, libraries, etc.
— Steve Purkis (@spurkis) February 1, 2022
The grammar of Onlinewardleymaps.com provides a basis for an open, low-threshold and simple standard format. Although this does not yet provide all of the required language features, and remains inconsistent in places, it is nonetheless very memorable, easy to use and already widespread in the community. Standardisation would allow other tool developers to work with Onlinewardleymaps.com to process maps without being tied to proprietary features. A well-defined, standardised language allows for the use of parser generators which in turn would reduce the implementation and maintenance burden for future tooling.
So, to say it in Simon Wardley’s own words, these should be the next steps for the Wardley Mapping Community:
- Know your users
- Be transparent
- Use a common language
- Be pragmatic
- Use standards where appropriate
- Design for constant evolution
- Set exceptional standards